 COMPREHENSIVE TOKENOMICS ANALYSIS")
EXECUTIVE SUMMARY
TRON ($TRX) is one of the most paradoxical assets in the top-10 cryptocurrency market. By almost every operational metric — daily transactions, stablecoin volume, fee revenue, TVL — it is a dominant force. By April 2026, TRON processes ~$189 million in monthly fees, ranks #1 in blockchain revenue (per DeFiLlama), hosts over $86 billion in USDT, and serves 2.6 million daily active users. Yet its tokenomics structure carries serious structural and governance red flags that prevent a higher rating.
The core tension: TRON is a thriving network with compromised token economics. The initial allocation was highly skewed toward insiders (45% to founder/foundation), vesting schedules were essentially non-existent (most supply released at TGE), the project faces an unresolved SEC lawsuit alleging fraud and market manipulation, and governance is deeply centralized in 27 Super Representatives — many of which are Justin Sun-affiliated entities. The deflationary burn mechanism is genuinely impressive and partially offsets these concerns, but it cannot erase them.
This report applies the 7-phase tokenomics framework to $TRX, drawing on data from CoinGecko, CoinMarketCap, DeFiLlama, TRONSCAN, and on-chain sources as of April 2026.
PHASE 1: TOKEN FUNDAMENTALS
1.1 Basic Information
| Parameter | Details |
| Token Name | TRON (Tronix) |
| Ticker | TRX |
| Blockchain | TRON Mainnet (own L1; also ERC-20 bridged version exists on Ethereum) |
| Token Standard | Native TRX (TRC-10 equivalent) + TRC-20 for bridged version |
| Contract / Explorer | TRONSCAN.org – Native L1 coin; no ERC-20 contract address for mainnet TRX |
| Launch / ICO Date | ICO: September 2017 | Mainnet Migration: June 25, 2018 (TRON Independence Day) |
| Age | ~103 months from ICO (August 2017) | ~94 months from mainnet (June 2018) |
| Verification Status | ✅ Verified on TRONSCAN. Open-source code on GitHub. Developer documentation at developers.tron.network |
Note: The SEC sued Justin Sun and TRON Foundation in March 2023, alleging unregistered securities sales and wash trading of TRX. The lawsuit remains active as of April 2026.
1.2 Supply Metrics
| Metric | Value | Assessment |
| Total Supply | ~94.70 billion TRX | Down from 102B peak; actively deflationary since April 2021 |
| Max Supply | No hard cap (elastic model) | ⚠️ Technically unlimited but structurally deflationary |
| Circulating Supply | ~94.70 billion TRX | ✅ Near-total supply is circulating (no vesting lock) |
| Circulating % | ~100% (est.) | ✅ Virtually all tokens are liquid |
| Burned All-Time | >40 billion TRX (~29% of original max) | ✅✅ Exceptional burn record since 2021 |
| Monthly Burn Rate | ~1.2 billion TRX/month (~$380M/month) | ✅✅ World-leading fee burn activity |
| Block Rewards (Daily) | ~28,800 TRX/day (8 TRX block + 128 TRX vote per block x 28,800 blocks) | Inflation ~3.77B TRX/year gross (0.4% of supply) |
| Net Inflation | NET DEFLATIONARY ~-2.9% annually | ✅✅ Burns far exceed new issuance |
🚨 Red Flag: No hard max supply cap — parameters can be changed by governance (27 SRs, many Sun-affiliated). However, the demonstrated burn trajectory and Proposal 51 changes have made this deflationary in practice.
1.3 Market Metrics (April 5, 2026)
| Metric | Value | Assessment |
| Current Price | $0.317 | Near midpoint of 52-week range |
| Market Cap | ~$30.1 billion | ✅ Top-8 globally (#8 by CMC) |
| Fully Diluted Valuation | ~$30.1 billion | ✅✅ FDV = MC (nearly all supply circulating) |
| FDV / MC Ratio | ~1.00x | ✅✅ Excellent – no hidden dilution overhang |
| 24h Trading Volume | ~$400-600M (variable) | ⚠️ Strong absolute volume but… |
| Volume / MCap Ratio | ~1.5-2% daily | 🚨 Below 3% threshold – low relative liquidity |
| All-Time High (ATH) | $0.4392 (December 4, 2024) | ⚠️ -27.8% from ATH |
| All-Time Low (ATL) | $0.0018 (2017 era) | ✅ +17,500%+ from ATL |
| 52-Week Range | $0.221 – $0.370 | Currently in upper-middle range |
1.4 Historical Price Performance
| Period | Performance | Trend | Key Catalyst |
| 7 Days | +0.8% | Slight uptrend | Institutional moves (Anchorage) |
| 30 Days | +~5% | Sideways/recovery | Mastercard PayFi partnership |
| 90 Days | +~10% | Gradual uptrend | Tron Inc. Nasdaq listing |
| 1 Year | +35% | Choppy uptrend | ATH Dec 2024, consolidation 2025 |
| Since ICO (2017) | +1,743% | Long-term uptrend | Multiple cycles, DeFi adoption |
| 2024 Full Year | +135% | Strong bull cycle | Grayscale consideration, WLF investment |
| 2025 Full Year | -9% (est.) | Underperformed vs L1 peers | Record network activity, price lagged |
Trend Observation: The most notable feature of TRX’s recent history is a widening disconnect between record-setting network metrics (revenue, transactions, USDT volume) and muted price performance in 2025. This price-activity decoupling is a key analytical signal.
PHASE 2: DISTRIBUTION & ALLOCATION
2.1 Initial Token Allocation (2017 TGE)
IMPORTANT: Unlike most modern projects, TRON’s entire initial supply was distributed at TGE in September 2017 with NO vesting schedules. All tokens were immediately liquid at launch. The original total supply was 100 billion TRX.
| Category | Allocation % | Token Amount | USD at Launch (~$0.017) | Notes |
| ICO / Public Sale | 40% | 40B TRX | ~$680M | Raised ~$70M actual |
| Private Investors | 15.75% | 15.75B TRX | ~$268M est. | No public investor list |
| TRON Foundation | 34% | 34B TRX | ~$578M est. | 🚨 Largest single allocation |
| Justin Sun (Company) | 10% | 10B TRX | ~$170M est. | 🚨 Direct founder control |
| TOTAL | 99.75%* | 99.75B TRX | ~$1.7B est. | *~0.25% misc/rounding |
⚠️ Data Caveat: Precise sub-allocation breakdowns for advisors, ecosystem, and marketing are not publicly disclosed in TRON’s original whitepaper with full granularity. The above reflects the best available public data. No separate advisor, marketing, or ecosystem fund tranches were clearly delineated in early documentation.
2.2 Distribution Analysis
| Group | Total % | Rating | Assessment |
| Insiders (Foundation + Sun Co.) | 44% | 🚨 CRITICAL | Exceeds 40% threshold – highly concentrated founder/foundation control |
| Community (Public ICO) | 40% | ✅ Adequate | 40% to public is above the 35% minimum threshold |
| Private Investors | 15.75% | ⚠️ Elevated | Institutional investors received 15.75% — no disclosed VC names |
| Protocol-Controlled (Treasury/DAO) | ~0% | ⚠️ Low | No defined DAO treasury at launch; TRON DAO Reserve established later ($1.1B assets) |
- 🚨 CRITICAL: Justin Sun controls approximately 44% of initial supply through Foundation + his company. Wikipedia confirms: ‘As of 2025, Sun currently controls the majority of TRX tokens in circulation.’
- 🚨 CRITICAL: NO vesting schedules were applied at TGE. All tokens were liquid from day one. This is an extreme departure from industry standards (typically 4-year vesting for teams).
- ⚠️ WARNING: Investor identities for the private round are not publicly disclosed — no Tier 1 VC validation possible.
2.3 Investor Details
| Round | Date | Amount Raised | Token Price | Notes |
| ICO (Public) | Sep 2017 | ~$70M (actual) | ~$0.0017 | Implied FDV: ~$170M; Current ROI: ~186x |
| Private Round | Aug-Sep 2017 | Undisclosed | Undisclosed | Investor identities not published |
| Tron Inc. (2025) | Jul 2025 | Nasdaq reverse merger | N/A | ~$200M TRX on corporate treasury as of Mar 2026 |
| Tron Inc. ($1B raise) | Early 2026 | $1B announced | N/A | To expand TRX treasury reserves |
2.4 Investor Quality Assessment
- 🚨 No Tier 1 VC firms (a16z, Paradigm, Polychain, Pantera, Sequoia, etc.) are publicly disclosed as investors in TRON. This is a significant deviation from leading protocols.
- ⚠️ The private round investor list was never publicly disclosed, making third-party validation impossible.
- ✅ Tron Inc.’s Nasdaq listing and institutional partnerships (Anchorage Digital, Zerohash, Mastercard) represent post-launch institutional validation, even if not classic VC backing.
Investor Quality Score: 3/10 🚨 (No disclosed institutional backers from 2017; partially offset by 2025-2026 institutional adoption)
PHASE 3: VESTING & UNLOCKS
3.1 Vesting Schedules
⚠️ CRITICAL FINDING: TRON’s original tokenomics included NO vesting schedules for any allocation category. All tokens — including founder, foundation, and investor allocations — were made immediately transferable at TGE in September 2017. This is among the weakest vesting structures in the top-20 crypto assets.
| Category | Cliff | Vesting Period | Total Duration | Full Unlock Date | Assessment |
| Team / Foundation | NONE | NONE | 0 months | Sep 2017 (TGE) | 🚨 Critical |
| Private Investors | NONE | NONE | 0 months | Sep 2017 (TGE) | 🚨 Critical |
| Public ICO | NONE | NONE | 0 months | Sep 2017 (TGE) | N/A (Public) |
- 🚨 CRITICAL: Zero cliff, zero vesting for team and insiders. Industry standard is 12-month cliff + 36-month linear vest. TRON had NONE of this.
- ✅ Mitigating factor: Since all tokens have been liquid since 2017, the ‘vesting risk’ window has long since passed. There are no pending cliff events or unlock events that could surprise the market today.
The absence of vesting was the primary red flag at project inception, but from a forward-looking perspective (April 2026), this risk is fully baked in. The supply is already fully circulating.
3.2 Unlock Calendar (Forward-Looking)
Since all TRX tokens were distributed at TGE and the supply model is deflationary (burns > issuance), there are NO scheduled unlock events going forward. The only supply changes are:
- ✅ Ongoing Burns: ~1.2 billion TRX/month removed from circulation (net supply reduction)
- ⚠️ Block Rewards: ~3.77 billion TRX/year issued as SR block rewards and voter incentives (net ~0.4% of supply)
- ✅ Net Effect: Burns (~14.4B/year) >> Rewards (~3.77B/year) = Net deflationary ~-3%/year
3.3 Unlock Pressure Analysis
| Period | Gross New Issuance | Estimated Burns | Net Change |
| Next 3 Months | +944M TRX (+0.1%) | -3,600M TRX (-3.8%) | -3.7% ✅✅ |
| Next 6 Months | +1,888M TRX (+0.2%) | -7,200M TRX (-7.6%) | -7.4% ✅✅ |
| Next 12 Months | +3,776M TRX (+0.4%) | -14,400M TRX (-15.2%) | -14.8% ✅✅ |
Unlock Pressure: NONE 🟢 (Deflationary dynamics dominate; no lock cliffs; supply shrinks)
3.4 Circulating Supply Projection
| Date | Est. Circulating Supply | Change vs Today | Assessment |
| Today (Apr 2026) | ~94.70B TRX | Baseline | Fully circulating |
| +3 Months | ~91.1B TRX | -3.8% (Net burn) | ✅✅ Deflationary |
| +6 Months | ~87.5B TRX | -7.6% | ✅✅ Deflationary |
| +12 Months | ~80.7B TRX | -14.8% | ✅✅ Significant supply reduction |
| +24 Months | ~67.7B TRX (est.) | ~-28.5% | ✅✅ Strong structural scarcity |
Dilution Assessment: NEGATIVE dilution (supply decreases) 🟢 — This is one of TRX’s strongest tokenomics features today.
PHASE 4: TOKEN UTILITY
4.1 Governance Rights
TRX holders stake to receive TRON Power (TP) at a 1:1 ratio. TP is used to vote for 27 Super Representatives (SRs) and up to 100 SR Partners, who are the elected block producers of the DPoS network.
- ⚠️ Voting occurs every 6 hours in rotating elections. SRs control network parameter changes via committee proposals (e.g., energy prices, burn rates, block rewards).
- 🚨 CRITICAL: Governance is highly centralized. Of the 27 elected SRs, multiple entities are Sun-affiliated or controlled. The ‘community governance’ framing obscures that one individual can effectively direct governance outcomes.
- ⚠️ Governance parameters include: block reward amounts, energy unit prices, fee burn rates, bandwidth parameters — all critical economic levers that are directly under SR control.
Governance Score: 4/10 ⚠️⚠️ (Technically functional but structurally centralized)
4.2 Staking
- ✅ TRX staking is live and extensively used. Stakers lock TRX to receive TRON Power and earn block rewards + voting rewards.
- ✅ No minimum stake amount. Flexible lock/unstake process (Stake 2.0, April 2023 upgrade removed 3-day unstaking wait).
- ✅ Staking APY: 3-7% from native staking; liquid staking via JustLend’s sTRX product offers similar yields.
- ✅ ~51% of circulating supply is currently staked (per mid-2025 data). This exceeds the 50% ‘excellent’ threshold.
- ✅ Tron Inc. (Nasdaq-listed) has staked $200M+ in TRX as of March 2026, and Anchorage Digital (federally chartered crypto bank) is integrating TRX staking.
Staking Score: 8/10 ✅✅
4.3 Revenue Share / Fee Capture
TRON’s fee model is unique: users stake TRX to receive ‘Energy’ and ‘Bandwidth’ resources for free-to-low-cost transactions. When users have insufficient staked TRX, fees are auto-burned. This means:
- ✅✅ Fee Burns create direct value for ALL TRX holders through supply reduction (deflationary scarcity).
- ✅ Stakers receive block rewards and voter rewards — these come from SR allocations (~3.77B TRX/year gross).
- ⚠️ There is NO direct revenue distribution to non-staking holders. Value accrual requires active staking.
| Revenue Metric | Figure | Assessment |
| Monthly Fee Revenue (DeFiLlama, Mar 2026) | $189.4M (30-day) | ✅✅ #1 blockchain by revenue globally |
| Annualized Fee Revenue | ~$2.27 billion/year | ✅✅ Exceptional real revenue generation |
| Revenue Per TRX (Annualized) | ~$0.024/TRX | ~7.6% yield on current price |
| Value Capture Mechanism | Burn + Staking Rewards | ✅✅ Dual mechanism |
| P/F Ratio (MCap/Annual Fees) | ~13.3x ($30.1B / $2.27B) | ✅ Under 15x = excellent value |
Fee Capture Score: 8/10 ✅✅
4.4 Utility Assessment
- ✅ REQUIRED USE: TRX is required to pay for transactions when energy reserves are insufficient. Every USDT-TRC20 transfer that burns TRX creates mandatory demand.
- ✅ STAKING / GOVERNANCE: TRX must be staked to access free bandwidth/energy resources and to vote in governance.
- ✅ DeFi COLLATERAL: TRX serves as core collateral in JustLend DAO (one of world’s top-3 lending protocols by TVL at ~$6.37B) and as backing for USDD stablecoin.
- ✅ PAYMENT NETWORK: TRX used for micro-fee payments, with Mastercard PayFi integration announced for 90M+ merchants (2026).
- ⚠️ FEE DISCOUNTS: Not a standalone feature; staking inherently provides free/reduced-cost transactions.
Utility Score: 8/10 ✅
4.5 Overall Utility Scorecard
| Utility Type | Exists | Score /10 | Weight | Weighted | Notes |
| Governance | Yes | 4/10 | 20% | 0.8 | Functional but centralized |
| Staking | Yes | 8/10 | 25% | 2.0 | ~51% staked, 3-7% APY |
| Revenue / Fee Burn | Yes | 8/10 | 35% | 2.8 | #1 blockchain revenue globally |
| Fee Discounts | Indirect | 6/10 | 10% | 0.6 | Free txns if sufficient stake |
| Required Use | Yes | 8/10 | 10% | 0.8 | Burns on insufficient energy |
| TOTAL | 100% | 70/100 | Strong Utility ✅ |
PHASE 5: INFLATION & SUPPLY DYNAMICS
5.1 Emission Schedule
TRON uses an elastic dual-track model: block rewards create new TRX (inflation); transaction fee burns destroy TRX (deflation). Net result is deflationary since April 2021.
| Period | Gross New TRX | Est. Burns | Net Supply Change |
| Daily | +3.74M TRX | -40M TRX | -36.3M TRX (Net ✅) |
| Monthly | +113M TRX | -1,200M TRX | -1,087M TRX ✅✅ |
| Annual | +1.37B TRX (+0.4%) | -14.4B TRX (-15.2%) | -13.0B TRX (-13.7%) ✅✅ |
| Year +1 (2027) | ~+1.3B (rewards may decrease) | ~-13B (network dependent) | Net ~-12B ✅✅ |
| Year +5 (2031) | ~+1.0B (governance adjustments) | ~-10B (if activity steady) | Net ~-9B ✅✅ |
Emission Type: Decreasing (via governance proposals reducing SR rewards) with increasing burn from network usage.
Current Net Inflation Rate: NEGATIVE ~-2.9% to -3.0% annualized ✅✅ (DEFLATIONARY)
5.2 Emission Distribution
New TRX emissions (block rewards) flow to: Super Representatives (~variable brokerage rates, 0-100% kept by SR) and Voter Rewards (distributed to TRX stakers proportionally).
- ✅ Block production rewards: 8 TRX per block (~$2.54) to SRs
- ✅ Voting rewards: 128 TRX per block (~$40.60) distributed to voters
- ✅ All emissions go to value creators: validators and active stakers. No treasury inflation.
Emission Distribution Score: ✅ (All to value creators)
5.3 Burn Mechanisms
- ✅✅ Type: Transaction Fee Burn — automatic TRX burn when users execute smart contracts without sufficient energy from staked TRX.
- ✅✅ All-Time Burned: Over 40 billion TRX destroyed since inception (~29% of original 140B pre-burn supply).
- ✅✅ Monthly Burn Rate: ~1.2 billion TRX/month (~$380M at current prices). Exceeds monthly SR reward issuance by ~10:1.
- ✅ USDD Mechanism: Burning TRX to mint USDD (though inactive since July 2022).
- ✅ Governance Mechanism: Proposal 51 (Feb 2021) and subsequent proposals have reduced SR rewards, tilting the net balance further toward deflation.
Net Inflation Rate: -2.9% to -3.0% annually. DEFLATIONARY ✅✅
This is the single strongest aspect of TRX tokenomics. The burn rate is organically driven by real network usage — primarily 75%+ of global USDT-TRC20 transfer volume.
5.4 Inflation Scoring
| Factor | Score /10 | Weight | Weighted | Notes |
| Current Inflation Rate (Deflationary) | 10/10 | 30% | 3.0 | Net -2.9% annually |
| Emission Schedule | 8/10 | 25% | 2.0 | Decreasing via governance |
| Burn Mechanisms | 10/10 | 25% | 2.5 | >40B TRX burned all-time |
| Net Inflation (Deflationary) | 10/10 | 20% | 2.0 | Burns >> Issuance |
| TOTAL | 100% | 95/100 | Exceptional ✅✅ |
PHASE 6: VALUE ACCRUAL & ECONOMICS
6.1 Protocol Revenue
| Period | Revenue (Fees) | Source |
| 30-Day (DeFiLlama, Mar 2026) | $189.4M | Transaction fees from smart contracts/transfers |
| Annualized Run Rate | ~$2.27 billion | #1 blockchain by revenue (DeFiLlama ranking, Mar 2026) |
| TVL (DeFiLlama) | ~$4.8-9.3B (sources vary) | Primarily JustLend DAO ($6.37B), SunSwap, JustStables |
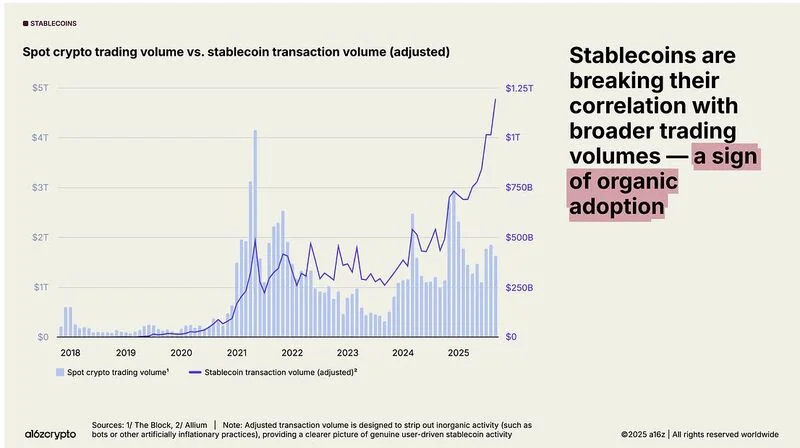
| USDT Supply Hosted | $86B+ USDT-TRC20 | 51%+ of global USDT transfer volume in Feb 2026 |
| Daily Active Users | ~2.6-2.8 million | More daily active wallets than Ethereum (1.9M) |
| Revenue Growth (2025) | +~40% YoY est. | Driven by stablecoin dominance & DeFi expansion |
Revenue breakdown by source: ~85% USDT-TRC20 transfers (energy burn fees), ~10% DeFi/DApp contract execution, ~5% other transfers and token operations.
6.2 Token Value Accrual Mechanisms
- ✅✅ PRIMARY: Fee Burn — every insufficiently-staked transaction destroys TRX permanently. With $2.27B/year in fees, this creates ~$2B/year in buy-pressure equivalent through supply reduction.
- ✅ SECONDARY: Staking Rewards — ~3.77B TRX/year (~$1.2B value) distributed to stakers and SR voters from block rewards.
- ✅ TERTIARY: Governance Control — stakers control network parameters including burn rates and reward schedules, creating alignment between TRX holders and ecosystem health.
- ⚠️ WEAK: USDD mint-burn — theoretically creates TRX demand when minting USDD, but mechanism has been inactive since July 2022.
| Token Sink | Annual Demand (est.) | Mechanism Strength | Rating |
| Fee Burns | ~$2.0B/year equivalent | Very Strong – organic demand | ✅✅ |
| Staking (Energy/BW) | ~51% of supply locked | Strong – functional necessity | ✅✅ |
| DeFi Collateral | ~$6B+ TRX staked in JustLend | Strong – growing DeFi ecosystem | ✅ |
| Tron Inc. Treasury | $200M+ (growing) | Medium – corporate demand signal | ✅ |
6.3 Valuation Metrics
| Metric | TRX Value | Threshold | Rating |
| P/F Ratio (MCap/Annual Fees) | ~13.3x ($30.1B / $2.27B) | Under 15x = Excellent ✅ | ✅ Fair valued |
| FDV P/F Ratio | ~13.3x (FDV = MCap) | Same as MCap P/F ✅ | ✅✅ |
| Revenue/TVL | ~24-47% (by TVL estimate) | Over 10% = Excellent ✅✅ | ✅✅ World-class |
| Token Yield (Fee Burn Equiv.) | ~7.5% ($2.27B / $30.1B) | vs T-Bills 4.5%, S&P Div 1.8% | ✅✅ Above risk-free rate |
| DeFiLlama P/F Rank | 87.1x cited (chain metric) | Different methodology note | ⚠️ Methodology varies |
Note on P/F discrepancy: Different sources report different P/F values because they use different revenue definitions. DeFiLlama’s chain P/F of 87.1x uses ‘app fees’ only. Using total on-chain fees ($2.27B annualized) gives ~13.3x which is the more relevant figure for TRX as the native fee-paying token.
6.4 Competitive Comparison
| Protocol | Market Cap | 30d Revenue | P/F Ratio | Net Inflation | Rating |
| TRX (TRON) | $30.1B | $189M ✅✅ | ~13x ✅✅ | -3% ✅✅ | ✅ |
| ETH (Ethereum) | ~$220B | ~$15M ⚠️ | ~1,200x 🚨 | -0.5% ✅ | ✅ |
| BNB (BNB Chain) | ~$85B | ~$30M ⚠️ | ~230x 🚨 | Variable | ⚠️ |
| SOL (Solana) | ~$65B | ~$22M ⚠️ | ~240x 🚨 | +8% ⚠️ | ⚠️ |
| AVAX (Avalanche) | ~$9B | ~$2M 🚨 | ~375x 🚨 | +4% ⚠️ | ⚠️ |
Verdict: By pure financial metrics (P/F ratio, fee yield, inflation), TRX is THE most undervalued major L1 relative to its revenue generation. Ethereum trades at 1,200x fees while TRX trades at ~13x — a 90x valuation gap. However, TRON’s centralization and regulatory risk justify a significant discount.
6.5 Token Demand Drivers
Short-Term (0-6 Months)
- ✅ Tron Inc. Nasdaq-listed entity buying $200M+ TRX on open market — consistent demand
- ✅ Anchorage Digital institutional custody + staking integration (March 2026) — new institutional inflows
- ✅ Mastercard PayFi partnership — 90M+ merchant network TRX/USDT integration
- ✅ Low unlock pressure (deflationary dynamics)
- ⚠️ SEC lawsuit unresolved — regulatory overhang caps upside
Medium-Term (6-18 Months)
- ✅ MetaMask native TRON support (Jan 2026) — massive new retail access
- ✅ $1B TRX treasury raise by Tron Inc. — corporate demand expansion
- ✅ JustLend DAO growth — TRX collateral demand increasing
- ⚠️ AI payment integration narrative (SunAgent, AINFT) — speculative
Long-Term (18+ Months)
- ✅ Stablecoin payment infrastructure moat — $86B USDT hosted, 51% global USDT volume
- ✅ Structural deflation accelerating — 40B+ TRX already permanently removed
- ⚠️ Regulatory resolution required for full institutional adoption
- 🚨 Centralization risk — if Justin Sun loses control or faces legal consequences, governance void
Demand Score: 6/10 ⚠️ (Strong fundamentals offset by legal and centralization risk)
PHASE 7: SCORING & FINAL ASSESSMENT
7.1 Category Scores
| Category | Score /10 | Weight | Weighted | Grade | Notes |
| Distribution Fairness | 3/10 | 20% | 6.0 | F 🚨 | 44% insiders, no vesting |
| Vesting Quality | 1/10 | 15% | 1.5 | F 🚨 | Zero vesting at TGE |
| Token Utility | 7/10 | 25% | 17.5 | C+ ⚠️ | Strong use cases, weak governance |
| Inflation / Supply | 9.5/10 | 20% | 19.0 | A+ ✅✅ | Net deflationary -3%/year |
| Value Accrual | 8/10 | 15% | 12.0 | B+ ✅ | P/F 13x, #1 revenue |
| Valuation | 8/10 | 5% | 4.0 | B ✅ | Undervalued vs fee generation |
| TOTAL | 100% | 60.0/100 | D | Below Average |
Grading Scale: 90-100 = A (Excellent) | 80-89 = B (Good) | 70-79 = C (Fair) | 60-69 = D (Below Average) | Under 60 = F (Poor)
Final Score: 60/100 — The network’s exceptional operational performance is deeply undercut by its foundational tokenomics structure (distribution, vesting). TRON is a high-quality blockchain with poor token design from its 2017 origins.
7.2 Strengths & Weaknesses
Top 5 Tokenomics Strengths
- ✅✅ DEFLATIONARY POWERHOUSE: Net -3% annual supply change driven by $2.27B/year in fee burns. Over 40B TRX permanently destroyed. Burns now exceed new issuance by 10:1.
- ✅✅ REVENUE SUPREMACY: #1 blockchain by monthly revenue (DeFiLlama, March 2026). P/F ratio of ~13x is best in class among all major L1s, making TRX arguably the most ‘fairly priced’ major layer-1 token.
- ✅✅ FDV = MARKET CAP: With ~100% of supply circulating, there is zero dilution overhang. What you see is what you get — no hidden supply bombs from vesting schedules.
- ✅ DEEP STAKING ADOPTION: ~51% of supply staked, providing network security and creating a large, illiquid holder base that supports price stability.
- ✅ INSTITUTIONAL VALIDATION (2025-2026): Nasdaq listing (Tron Inc.), Anchorage Digital custody, Mastercard PayFi, MetaMask support — legitimate institutional infrastructure building.
Top 5 Tokenomics Concerns
- 🚨 EXTREME INSIDER CONCENTRATION: Foundation (34%) + Justin Sun Company (10%) = 44% initial allocation to two entities controlled by one person. This is one of the most centralized major-L1 distributions in crypto.
- 🚨 ZERO VESTING: No vesting schedules were ever applied to any allocation. While this risk has largely passed (7+ years ago), it reflects a fundamentally founder-favorable token design.
- 🚨 SEC LAWSUIT UNRESOLVED: Active federal litigation for securities fraud, market manipulation, and wash trading (filed March 2023, still active as of April 2026). This is a material regulatory risk.
- 🚨 GOVERNANCE CENTRALIZATION: 27 SRs control all network parameters including burn rates, reward schedules, and energy prices. Multiple SRs are Sun-affiliated. Governance can reverse deflationary mechanisms.
- ⚠️ PRICE-ACTIVITY DISCONNECT: Record network activity in 2025 yet TRX closed the year down ~9% vs all-time high. The market is discounting extraordinary operational metrics due to regulatory and centralization risk.
7.3 Red Flags Summary
Critical Red Flags 🚨 (Structural Issues)
- 🚨 Over 44% to insiders with ZERO vesting — worst-in-class insider allocation at TGE
- 🚨 SEC lawsuit: unregistered securities, fraud, wash trading — potential for token classification as security
- 🚨 Justin Sun effectively controls majority of TRX in circulation per Wikipedia (2025)
- 🚨 Governance controlled by ~27 SRs, multiple Sun-affiliated — can reverse any tokenomics parameter
Major Red Flags 🚨 (Serious Concerns)
- 🚨 No Tier 1 VC investor base — investor quality score 3/10
- 🚨 No disclosed private round investor identities
- ⚠️ Dubai court froze $456M linked to Justin Sun’s bailout of TrueUSD issuer Techteryx (Nov 2025)
Minor Red Flags ⚠️ (Worth Noting)
- ⚠️ Volume/MCap ratio below 3% (low relative to market cap)
- ⚠️ Price underperformed in 2025 despite record metrics — market pricing in risk
- ⚠️ USDD mint-burn mechanism inactive since July 2022 — unused utility
- ⚠️ Heavy reliance on USDT-TRC20 as primary revenue driver — concentration risk
7.4 Investment Thesis
Bull Case (Why Tokenomics Could Support Appreciation)
1. Revenue-Driven Burn Acceleration: If USDT-TRC20 volumes continue growing (or expand via Mastercard PayFi), burn rates could increase to 2B+ TRX/month, accelerating deflation beyond -3%/year. At 80B TRX circulating by 2027, the same demand would produce a higher price.
2. Institutional Re-Rating: Anchorage Digital (federally chartered), Nasdaq listing, and $1B corporate TRX treasury create a legitimate institutional demand floor. Resolution of the SEC lawsuit could trigger a significant re-rating of TRX from ‘regulatory risk’ to ‘regulated stablecoin infrastructure.’
3. Extreme P/F Undervaluation: At ~13x P/F vs Ethereum at 1,200x and Solana at 240x, even partial convergence toward peer multiples (e.g., 30x P/F) would imply a TRX price of $0.70+. The market is applying an extreme discount for centralization/regulatory risk — if that risk resolves, upside is substantial.
Bear Case (Why Tokenomics Could Underperform)
1. SEC Prosecution Escalation: If the DOJ pursues criminal charges against Justin Sun (as was rumored in 2022 Verge reporting), TRX could face exchange delistings, regulatory classification as an unregistered security, and a collapse in institutional adoption.
2. Governance Attack / Centralization Failure: Justin Sun’s legal troubles in multiple jurisdictions (SEC, Dubai courts) could destabilize governance. With no meaningful decentralized backup governance, a sudden loss of the founder’s coordination role would leave a power vacuum among the 27 SRs.
3. USDT Dependency Risk: If Tether migrates USDT operations to a different blockchain (e.g., Ethereum L2s with lower fees), or if Circle’s USDC displaces USDT-TRC20 in emerging markets, TRON’s fee burn engine could collapse. $189M/month in fees is almost entirely dependent on USDT dominance on TRC-20.
Base Case Expectation
TRX remains range-bound between $0.25-$0.40 in 2026, with gradual institutional adoption building a floor and regulatory risk maintaining a ceiling. The deflationary supply dynamics provide structural support, but the SEC lawsuit and centralization discount prevent a sustained re-rating.
7.5 Final Rating
| Rating Dimension | Assessment |
| TOKENOMICS SCORE | 60/100 — D Grade |
| GRADE | D — Below Average |
| RISK LEVEL | HIGH — SEC litigation, governance centralization, founder concentration |
| RECOMMENDATION | HOLD — Exceptional network metrics offset by critical structural tokenomics flaws |
| CONFIDENCE | Medium — Core fundamentals clear; outcome depends on SEC resolution and institutional adoption timeline |
7.6 Peer Ranking
| Token | Tokenomics Score | Distribution | Vesting | Revenue | Overall Rank |
| ETH | 82/100 B | ✅ (EIP-1559) | ✅ (Long-term) | ⚠️ ($1.25M/mo) | #1 ✅✅ |
| BNB | 72/100 C | ⚠️ (CZ control) | ⚠️ (Partial) | ⚠️ ($30M/mo) | #2 ✅ |
| SOL | 70/100 C | ⚠️ (VC heavy) | ✅ (Strong) | ⚠️ ($22M/mo) | #3 ✅ |
| TRX | 60/100 D | 🚨 (44% insiders) | 🚨 (Zero) | ✅✅ ($189M/mo) | #4 ⚠️ |
| AVAX | 64/100 D | ⚠️ (Moderate) | ✅ (Decent) | 🚨 ($2M/mo) | #5 ⚠️ |
TRX ranks #4 among major L1 tokens in overall tokenomics quality. It is the unambiguous #1 by revenue and P/F ratio, but ranks last by distribution fairness and vesting quality among peers. The paradox: best operational fundamentals, worst tokenomics structure.
DATA SOURCES & METHODOLOGY
| Data Type | Primary Source | Verification Source |
| Price / Supply / MCap | CoinGecko (coingecko.com) | CoinMarketCap, Yahoo Finance |
| Protocol Revenue / TVL | DeFiLlama (defillama.com) | MEXC News, CoinLaw Statistics |
| Burn Data / Supply History | TRONSCAN (tronscan.org) | CryptoQuant, AInvest analyses |
| Tokenomics / Technical | TRON Developer Hub (developers.tron.network) | Messari, Cube.Exchange research |
| Legal / Regulatory | SEC.gov official filings (March 2023) | CoinDesk, Blockworks, DL News |
| Historical / Background | Wikipedia (Justin Sun article) | Changelly, CoinLore historical data |
| Staking Data | 99Bitcoins, MilkRoad staking guides | CoinLaw TRX statistics 2025 |
| DeFi Ecosystem | ChainCatcher (JustLend data) | DeFiLlama protocol pages |
| Latest News (2026) | CoinMarketCap CMC-AI updates | MetaMask price page, CoinDesk |
— END OF REPORT —
Analysis date: April 5, 2026 | For informational purposes only. Not financial advice.


")


")


